AI & DATA SCIENCE / OPERATIONAL GOVERNANCE
Software licence intelligence
Usage data can inform licence decisions when context and human review are built in.
How the use case emerged
Licence totals alone could not explain adoption or under-use. I framed an analysis around renewal planning, support needs and cases that might warrant an administrator's review.
The analysis
A December 2025 notebook explored licence type, activity recency, content creation and exceptions for human review. It tested a simple candidate rule, classification, clustering and a forecast idea; none should be treated as a deployed decision engine. Python was used to reconcile licence and activity fields, define recency consistently, compare broad utilisation patterns and explore simple review rules and models for changes in use. This separated a useful renewal question from a user-level action. The public narrative is deliberately aggregate: it does not name users, show account-level activity or reproduce the export.
From licence export to a review question
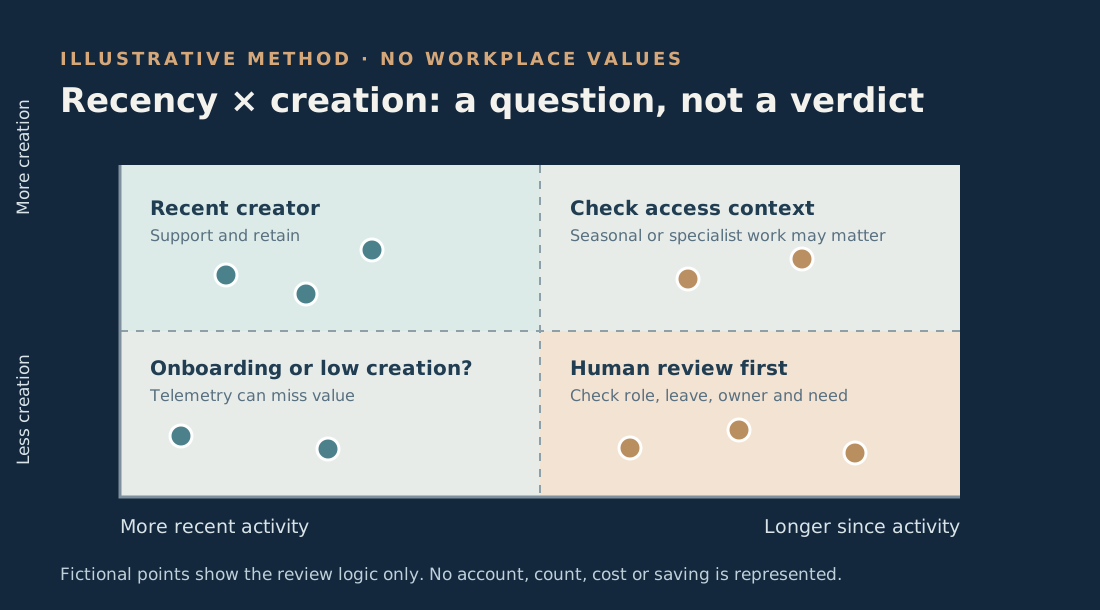
A visual decision boundary
The source charts contain real operational counts, so the public exhibit redraws their analytical question using fictional points and no actual account or commercial values.
A second lens: diagramming licences
A separate December 2025 analysis examined a diagramming platform’s licence status, activity recency and document use in a restricted user-level export. Its notebook produced eight diagnostic visualisations and explored four modelling ideas, including inactivity and segmentation. Those outputs helped frame questions for a licence owner, but an export containing identifiers, activity and team context is not suitable for public screenshots. The same caution applies to both products: a modelled “potential reclaim” is not an action taken or a saving realised.
The decision point
A possible reclaim candidate is an invitation to check role, access needs and context. It is not evidence that a licence was removed or money was saved. Low activity can reflect leave, seasonal work or incomplete telemetry.
What the prototype taught me
Counts of each user’s last-active month describe a snapshot, not a time series of the number of active users in every month. The initial forecasting chart therefore cannot establish a reliable future licence requirement. A sound renewal model would need repeated historical snapshots and validation against subsequent periods.
Accuracy alone was not enough to trust individual predictions; class-level errors and repeated observations matter. Any operational use would require validation, proportionate access and an administrator's decision before action.
Evidence boundary: The analysis used real, restricted operational exports. The illustration is fictional and no personal account data or commercial price is published; the aggregate candidate count below is not a realised saving. The original Python is privately maintained; I can explain the methods and their limits.
A CLOSER LOOK
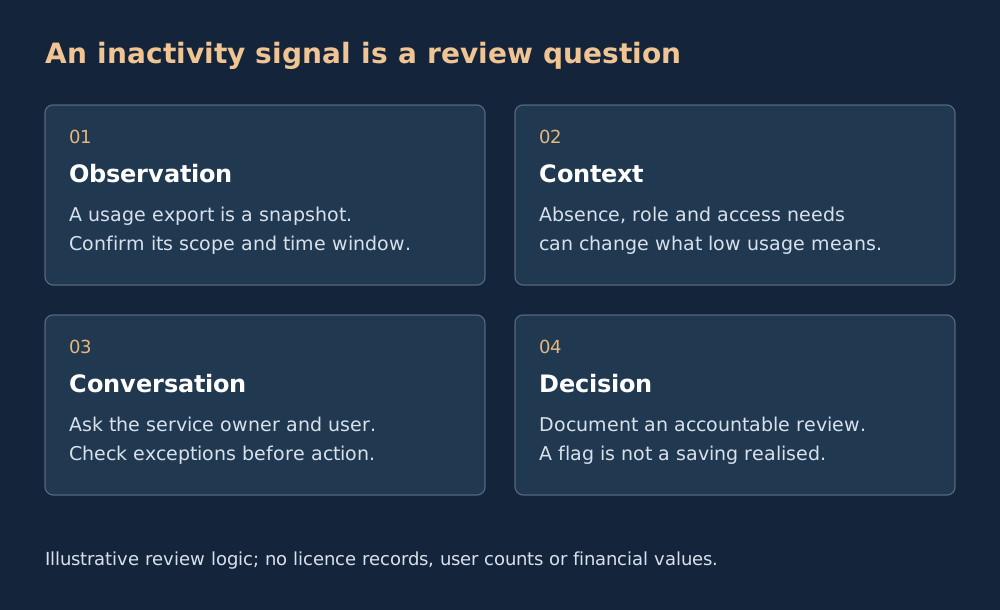
Keep a person beside the signal
Miro review candidates
The original Miro analysis recorded 31 potential full-licence reclaim candidates identified for administrator review. A candidate was not a licence already reclaimed or a confirmed saving; activity and role context still needed checking.
VALUE / CONTEXT / HUMAN REVIEW
Commercial judgement alongside analysis.
I supported value-for-money decisions through usage analysis, resource planning and options appraisal. That involved examining demand and context with colleagues, rather than treating low activity as an automatic removal instruction. Formal budget ownership remained with the relevant accountable roles.
Explore Business Analysis & Consultancy Foundations · Try the Evidence Chain Studio
EXPLAINABLE AI & DATA / READ THE METHOD
Read the evidence, understand the method.
A guide to the charts and case evidence on this page. Exhibit captions remain the authority for data origin and the claims each visual supports.
Follow the reasoning.
- SourceRead the exhibit’s evidence label
- RepresentInspect units, categories and scales
- CompareDistinguish observed results from demonstrations
- ReviewCheck limitations before taking action
Explore the building blocks.
Number of concepts in this guide, not performance or usage measures.
Explore the explanation matrix · 14 concepts
14 concepts shown
On small screens, scroll the table sideways. “Learning context” explains a related idea; it does not mean that method runs on this page. Deep learning is the standard term for “deep ML”.
| Technical term | Technical description / definition | In plain English | How this page uses it |
|---|---|---|---|
| Visual encodingVisualisation | Mapping values or categories to marks, position, length, colour and labels.Primary reference ↗ | Make the comparison visible, with a scale and a clear label. | Published analysis Read axis labels, denominators and captions before comparing exhibits. |
| Synthetic dataAI/Data Concepts | Generated records used to represent scenarios rather than directly report observed individuals or events.Primary reference ↗ | A practice dataset. Useful for demonstration, not proof of workplace impact. | Demonstration Exhibits labelled synthetic or reconstructed illustrate methods; they are not disclosed workplace records. |
| Descriptive analyticsAI/Data Concepts | Summaries of observed data using counts, rates, distributions or comparisons.Primary reference ↗ | Tell us what the records show; this alone does not predict next week. | Published analysis Counts and trend summaries describe the stated records and period, not future performance. |
| Residuals and prediction errorEvaluation & XAI | A residual compares an observed value with its fitted or predicted value. Error metrics summarise those discrepancies.Primary reference ↗ | How far did the estimate miss, and where does it miss most? | Learning context Prediction exhibits can compare observed and estimated values; a smooth chart alone is not validation. |
| Confusion matrix, precision and recallEvaluation & XAI | A confusion matrix counts predicted versus actual classes. Precision measures positive-result reliability; recall measures positive-case coverage.Primary reference ↗ | Which alarms were right, which were false, and which cases were missed? | Learning context Where a confusion chart is shown, inspect false alarms and missed cases as well as correct predictions. |
| Data science pipelineData Science Pipeline | An ordered, reproducible sequence for acquiring, validating, preparing, analysing and evaluating data.Primary reference ↗ | A chain from a question and source to an answer someone can check. | Published analysis Case studies connect the problem, evidence, preparation, method, evaluation and decision. |
| Explanation versus causal proofEvaluation & XAI | A model explanation describes selected behaviour or contributions; it does not establish causal effects or full reliability.Primary reference ↗ | A reason for this output is useful, but it is not proof that the model is right. | Responsible use A persuasive visual does not prove causation or transferability. |
| Data minimisationResponsible AI | Limit collected, disclosed and retained information to what is needed for the stated purpose.Primary reference ↗ | Use the smallest appropriate amount of information. | Responsible use Restricted source records stay private; approved aggregates and labelled reconstructions support public learning. |
| pandasPython Package | A Python library for labelled tabular data manipulation and analysis.Primary reference ↗ | A programmable workbench for cleaning and comparing tables. | Learning context A common Python option for tabular preparation; its inclusion is not a claim that this browser runs pandas. |
| MatplotlibPython Package | A Python plotting library for static, animated and interactive visualisations.Primary reference ↗ | Turn numerical work into labelled figures that can be inspected and shared. | Learning context A common way to prepare Python figures. This page displays published assets rather than launching Python plotting sessions. |
| Machine learning (ML)AI Capability | Methods that estimate patterns or parameters from examples to support inference on other inputs.Primary reference ↗ | Learn a pattern from examples, then check whether it helps with new ones. | Learning context ML learns from examples. Read the page-specific methods below to see whether any model runs here. |
| Deep learningAI Capability | Machine learning using neural networks with multiple representation-learning layers.Primary reference ↗ | A layered model learns useful representations; more layers do not guarantee a better answer. | Learning context Deep learning is an AI capability, not a label for every chart. No deep model is implied by this explanation panel. |
| Natural language processing (NLP)AI Capability | Computational methods for representing, analysing or generating human language.Primary reference ↗ | Help a computer work with words, while remembering that context matters. | Learning context Text search, translation, thematic classification and generation are different language tasks; their implementation is identified separately. |
| Sentiment analysisAI Capability | A language-analysis task that estimates an expressed attitude, often as polarity or sentiment categories.Primary reference ↗ | Estimate the tone of words—not the private feelings or personality of their author. | Learning context Sentiment estimates expressed tone. It must not be confused with topic classification or a diagnosis of a person. |
No matching concepts. Choose another category or clear the search.