APPLIED AI / DATA SCIENCE / CHANGE
AI & Data Science Portfolio
I find decisions that need better evidence, choose data that can be used responsibly, and turn analysis into a practical change people can own.
Explore the teaching modelsTHE THREAD THROUGH THE WORK
Discovery, evidence, action.
These projects grew from workplace questions: where procurement slows, how students experience digital services, what a feedback log can and cannot tell us, and whether software licences are being used well. Alongside the investigations, I built a more data-aware Business Analysis Capability: a structured service offer, project-specific delivery frameworks, an AI and data learning pathway, and a method for assessing opportunities before investing in a model. My MSc methods strengthened the analysis; internal consultancy and change leadership made the work usable.
Each case identifies its data basis and stage. Restricted real-data analyses, synthetic demonstrations and academic governance proposals have different kinds of evidence and different limits. The public pages contain no raw workplace records. The eight BA data assets behind the capability are described separately ↗
How I take a use case through delivery ↗Follow a real question into the method.
Begin with the case studies below. To test the analytical ideas, visit the Smart Procurement Lab or Applied Analytics Lab. Both expose their fictional inputs, methods and limits alongside the outputs.
MILESTONES / THE CAPABILITY IN PRACTICE
From a stronger foundation to a better decision.
These stages connect BA Capability leadership, MSc study and applied investigations. They describe distinct kinds of work rather than a single deployed platform.
Make work legible
Led the BA Capability, a team of 10 analysts, and authored a catalogue of more than 100 activities mapped to eight delivery gates. Process, persona and data-requirements guidance made the service offer more explicit and reusable.
BA Capability & internal consultancy ↗ 02 / CAPABILITYShare the learning
Designed a six-course, roughly 29-hour team pathway from data literacy to applied AI and Python, with seven group sessions proposed alongside self-study. My nine-module MSc is a separate personal qualification.
Module map ↗ 03 / REAL-DATA INSIGHTMake evidence comparable
Harmonised real student-feedback exports across 2023/24–2025/26. Separately explored restricted feedback and software-usage sources, each for a defined decision and with its own limits.
Survey case ↗ 04 / SYNTHETIC TESTINGTest before relying
Used 5,000 curated synthetic purchase-order records to investigate four model questions. Related academic studies rehearsed staff and student experience methods without live prediction claims.
Capstone ↗ 05 / ASSURANCEPut judgment beside the signal
Compared baselines, explained uncertainty and identified review owners. A promising prototype needs permission, real-world validation and adoption measures before operational use.
Delivery method ↗TEAM & PROJECT MILESTONES
Building the conditions for useful analysis.
The artefacts below show how I translated individual learning into a capability standards and project methods. Their delivery stage is part of the story.
A service offer analysts can explain
A structured activity catalogue, eight-gate alignment and process-modelling standard made work easier to scope, trace and review. A Jira board was prototyped as a further visibility step.
Explore the BA Capability ↗ AUTHORED · PROJECT FRAMEWORKSData questions at the right stage
I prepared tailored BA approaches for learner engagement, service management, assets and workplace operations: source, owner, quality, interface, reporting and adoption questions. The documents describe recommended work, not completed system outcomes.
See my approach ↗ TESTED · CONTROLLED POCAgent feasibility with guardrails
An October 2025 guide reported 91% success across 11 controlled Copilot Studio checks. Synthetic examples and test identities supported the PoC; wider service readiness remained a separate decision.
Read the PoC ↗ DESIGNED · TEAM LEARNINGFrom individual study to shared fluency
A six-course pathway brought about 29 hours of material into a plan for seven three-hour team sessions plus self-study. The schedule and showcases supported adoption design; completion by every colleague is not claimed.
Explore the learning ↗01 / APPLIED CASES
Workplace questions, tested methods
Open a case to see the question, dataset, approach, intended change and limits.
Procurement intelligence
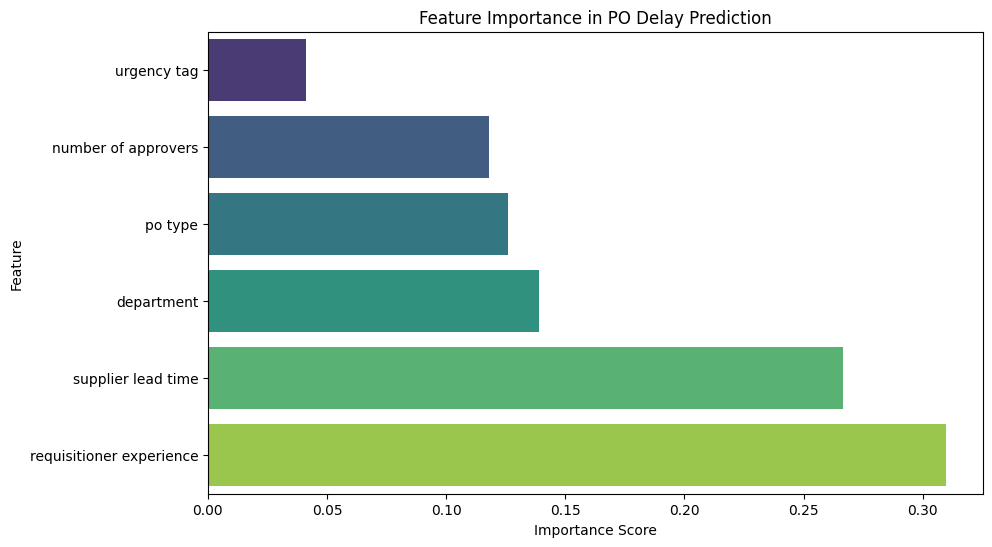
Real process discovery shaped four questions; curated synthetic records tested delay, approval, anomaly and carbon estimates in a notebook demonstrator.
Read the case ↗ STUDENT EXPERIENCE · RESTRICTED REAL DATAWelcome Week insight
Three annual feedback cycles were cleaned, aligned and compared, with missing answers and proxy measures made visible.
Read the case ↗ PEOPLE ANALYTICS · RESTRICTED REAL DATABA feedback analytics
Text and thematic methods explored a positive-feedback log; selective recording makes individual performance inference unsafe.
Read the case ↗ TOOL GOVERNANCE · RESTRICTED REAL DATASoftware licence intelligence
Usage and licence fields were standardised to flag questions for adoption support and renewal review, with context before action.
Read the case ↗ PERSONAL FIELD NOTES · EXPLORATORY PYTHONChelsfield football lab
Mark’s club statistics prompted my 2025 Python notebook. The new browser-only player lab explores dated form, milestones, editable SWOTs and an honest walk-forward forecast check without copying his database.
Visit the football page ↗02 / CONNECTED AREAS
Three places the capability travels.
Process and procurement
Follow a problem from stakeholder mapping through a governed synthetic model demonstrator.
Explore operations ↗02 / PEOPLE & EDUCATIONExperience and early signals
Connect real service feedback with carefully bounded academic prediction exercises.
Explore the research ↗03 / CULTURE & LANGUAGEWhose knowledge counts?
Yorùbá language governance and heritage ethics connect technical work to cultural stewardship.
Explore cultural AI ↗03 / THE LEARNING ENGINE
From MSc learning to a team capability.
Watch my QMUL staff-apprenticeship interview: returning to mathematics, building confidence and bringing AI and data science learning into the team I led.
Nine connected modules, including the capstone, link technical methods to decisions, communication and responsible change. Explore selected studies and the evidence behind them.
Explore the module mapBrowse 60 learning topics · How I would measure adoption and service value
Python code and notebooks for selected studies are privately stored and maintained by me. I’m happy to answer questions about the methods and their limits.
A CLOSER LOOK
Inspect the errors
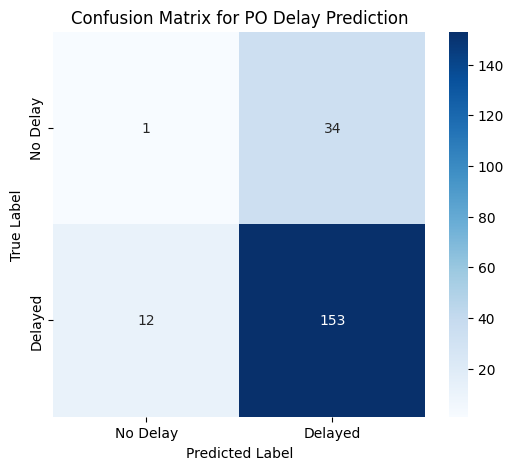
What the model relied on
Try the Smart Procurement Lab.
Four explainable prototypes: PO delay · Approval bottlenecks · Anomaly review · Carbon impact. Change fictional inputs, compare scenarios and inspect measured synthetic-test results.
BUSINESS ANALYSIS & CONSULTANCY FOUNDATIONS
Earlier work. Enduring methods.
Explore non-AI delivery examples separately: requirements, service change, migration discovery and facilitation. These experiences underpin the AI and data portfolio.
Explore the foundational projects and two practical exercises · Six steps from process evidence to responsible change
APPLIED AI / REGIONAL FORECAST LAB
Explore a future. Inspect the model behind it.
Train a regional revenue model, inspect chronological backtests and adjust population, youth, GDP and resource scenarios.
Open the Regional Forecast Lab →EXPLAINABLE AI & DATA / READ THE METHOD
Read the evidence, understand the method.
A guide to the charts and case evidence on this page. Exhibit captions remain the authority for data origin and the claims each visual supports.
Follow the reasoning.
- SourceRead the exhibit’s evidence label
- RepresentInspect units, categories and scales
- CompareDistinguish observed results from demonstrations
- ReviewCheck limitations before taking action
Explore the building blocks.
Number of concepts in this guide, not performance or usage measures.
Explore the explanation matrix · 14 concepts
14 concepts shown
On small screens, scroll the table sideways. “Learning context” explains a related idea; it does not mean that method runs on this page. Deep learning is the standard term for “deep ML”.
| Technical term | Technical description / definition | In plain English | How this page uses it |
|---|---|---|---|
| Visual encodingVisualisation | Mapping values or categories to marks, position, length, colour and labels.Primary reference ↗ | Make the comparison visible, with a scale and a clear label. | Published analysis Read axis labels, denominators and captions before comparing exhibits. |
| Synthetic dataAI/Data Concepts | Generated records used to represent scenarios rather than directly report observed individuals or events.Primary reference ↗ | A practice dataset. Useful for demonstration, not proof of workplace impact. | Demonstration Exhibits labelled synthetic or reconstructed illustrate methods; they are not disclosed workplace records. |
| Descriptive analyticsAI/Data Concepts | Summaries of observed data using counts, rates, distributions or comparisons.Primary reference ↗ | Tell us what the records show; this alone does not predict next week. | Published analysis Counts and trend summaries describe the stated records and period, not future performance. |
| Residuals and prediction errorEvaluation & XAI | A residual compares an observed value with its fitted or predicted value. Error metrics summarise those discrepancies.Primary reference ↗ | How far did the estimate miss, and where does it miss most? | Learning context Prediction exhibits can compare observed and estimated values; a smooth chart alone is not validation. |
| Confusion matrix, precision and recallEvaluation & XAI | A confusion matrix counts predicted versus actual classes. Precision measures positive-result reliability; recall measures positive-case coverage.Primary reference ↗ | Which alarms were right, which were false, and which cases were missed? | Learning context Where a confusion chart is shown, inspect false alarms and missed cases as well as correct predictions. |
| Data science pipelineData Science Pipeline | An ordered, reproducible sequence for acquiring, validating, preparing, analysing and evaluating data.Primary reference ↗ | A chain from a question and source to an answer someone can check. | Published analysis Case studies connect the problem, evidence, preparation, method, evaluation and decision. |
| Explanation versus causal proofEvaluation & XAI | A model explanation describes selected behaviour or contributions; it does not establish causal effects or full reliability.Primary reference ↗ | A reason for this output is useful, but it is not proof that the model is right. | Responsible use A persuasive visual does not prove causation or transferability. |
| Data minimisationResponsible AI | Limit collected, disclosed and retained information to what is needed for the stated purpose.Primary reference ↗ | Use the smallest appropriate amount of information. | Responsible use Restricted source records stay private; approved aggregates and labelled reconstructions support public learning. |
| pandasPython Package | A Python library for labelled tabular data manipulation and analysis.Primary reference ↗ | A programmable workbench for cleaning and comparing tables. | Learning context A common Python option for tabular preparation; its inclusion is not a claim that this browser runs pandas. |
| MatplotlibPython Package | A Python plotting library for static, animated and interactive visualisations.Primary reference ↗ | Turn numerical work into labelled figures that can be inspected and shared. | Learning context A common way to prepare Python figures. This page displays published assets rather than launching Python plotting sessions. |
| Machine learning (ML)AI Capability | Methods that estimate patterns or parameters from examples to support inference on other inputs.Primary reference ↗ | Learn a pattern from examples, then check whether it helps with new ones. | Learning context ML learns from examples. Read the page-specific methods below to see whether any model runs here. |
| Deep learningAI Capability | Machine learning using neural networks with multiple representation-learning layers.Primary reference ↗ | A layered model learns useful representations; more layers do not guarantee a better answer. | Learning context Deep learning is an AI capability, not a label for every chart. No deep model is implied by this explanation panel. |
| Natural language processing (NLP)AI Capability | Computational methods for representing, analysing or generating human language.Primary reference ↗ | Help a computer work with words, while remembering that context matters. | Learning context Text search, translation, thematic classification and generation are different language tasks; their implementation is identified separately. |
| Sentiment analysisAI Capability | A language-analysis task that estimates an expressed attitude, often as polarity or sentiment categories.Primary reference ↗ | Estimate the tone of words—not the private feelings or personality of their author. | Learning context Sentiment estimates expressed tone. It must not be confused with topic classification or a diagnosis of a person. |
No matching concepts. Choose another category or clear the search.