SELECTED WORK / VISUAL EVIDENCE
Evidence in view.
The operating models, analyses and prototypes behind the portfolio, made legible without publishing workplace records. A diagram should earn its wall space.
A PUBLIC VIEW OF THE WORK
Pictures should explain the decision.
These exhibits draw on working presentations and notebooks from 2022–26. Charts from the synthetic procurement, staff and student demonstrators are shown as original notebook or report outputs. The licence matrix and other diagrams are public reconstructions of my methods, because the source slides contain employer branding, colleague names, internal system details or restricted records.
Dates describe when the work was documented. A proposal, a prototype, a controlled test and a delivered analysis are labelled separately. The full decks, code and operational datasets remain privately held; I’m happy to discuss the methods and their limits.
01 / BA CAPABILITY
Building an internal consultancy.
The work began with a team vision and a practical resourcing approach, then matured into shared learning, measured activity and a defined service offer. The view below describes the approach without reproducing internal staffing or activity records.
People, demand, practice and a repeatable offer
Team standards, mentoring and prioritisation criteria became explicit.
Practice sharing, feedback and activity measures helped identify where support was needed.
Persona, process and data requirements guidance made analysis easier to reuse.
The offer was documented with outputs, effort cues and stage alignment.
Data was built into the method: an August 2024 requirements draft made source, ownership, quality and validation explicit; a July 2025 strategy adapted them to four service domains. A December 2025 six-course learning pathway and February 2026 process approach followed. The proposed single portfolio view was a design goal, not a deployed data product. See the data assets ↗
Read the BA Capability case study ↗02 / PERSONAS PLAYBOOK
Make complex services human.
A shared playbook connected roles, journeys and touchpoints so teams could ask who a change affected. The discovery and validation were collaborative. This view replaces internal persona sheets and stakeholder lists with the public logic of the work.
A journey, rather than a label
PROCESS / OPERATING MODEL
Let project learning travel.
A later executive proposal connected the useful process model made for a project with an enterprise view of ownership, variants and automation readiness. It recommended a pilot before wider adoption. This diagram shows the proposed handoff, not an established enterprise platform.
From one project model to shared process knowledge
03 / PROCUREMENT MODELS
What a model can show—and miss.
Process discovery gave the problem shape. A separate MSc demonstrator used fictional purchase-order records to investigate delays, approval stages, unusual patterns and carbon estimates. The gallery below shows unaltered chart outputs from synthetic-data notebooks. They show modelling work, not live financial results.
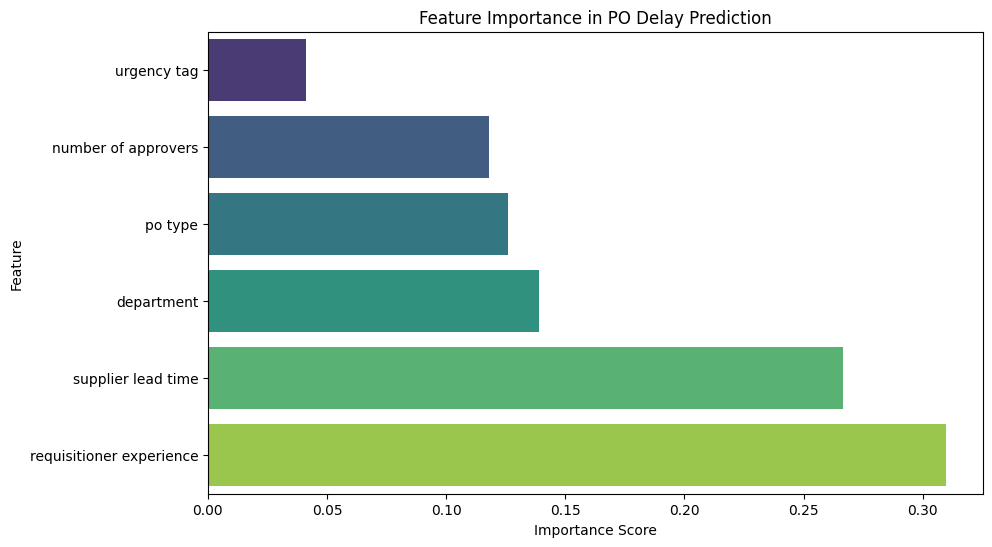
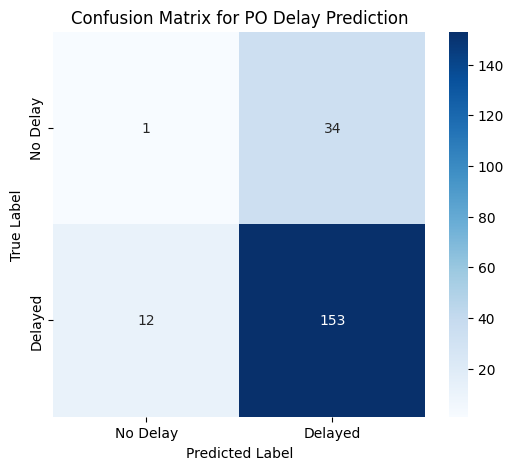
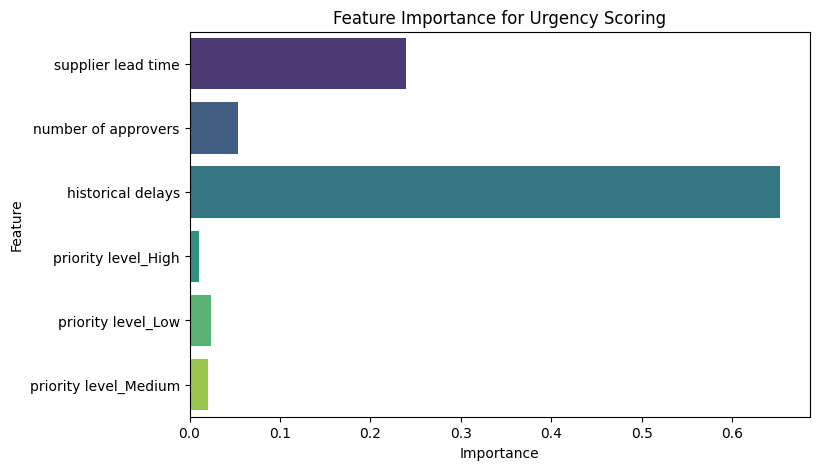
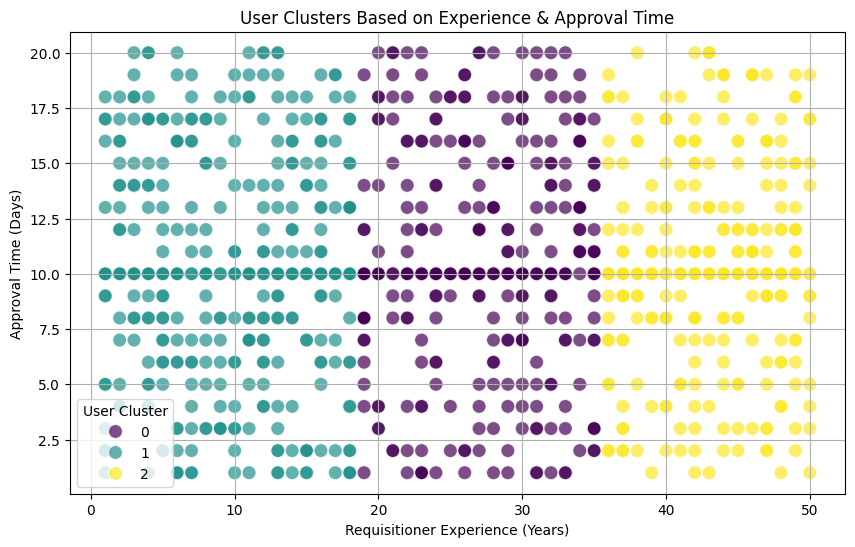
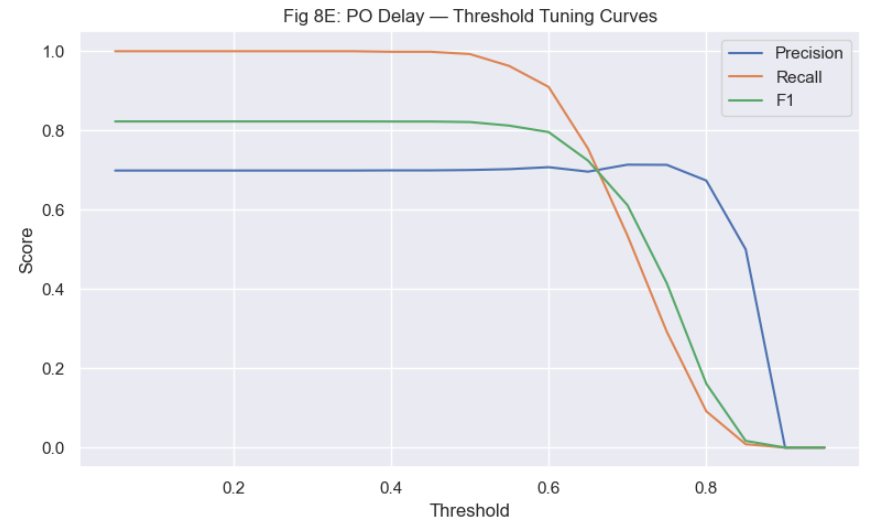
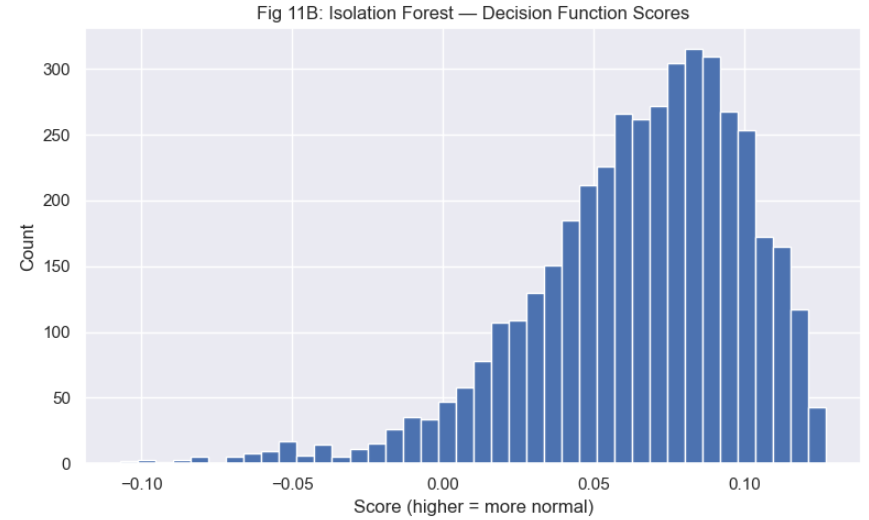
The broader notebook experimented with eight applications. The public case study focuses on four chosen investigations because they formed the most coherent, explainable pilot scope. Both are demonstrators; neither represents a deployed scoring service.
Explore the procurement study ↗03B / CARBON IMPACT PROXY
Put an indicative carbon signal beside spend.
In the MSc capstone, a synthetic purchase-order dataset was mapped from category and spend to an estimated kg CO₂e proxy. The source notebooks produced the category and department charts below. The colourful interpretation shows the calculation for an equal-spend example. This is a transparent factor mapping, not a validated prediction of supplier-specific emissions.
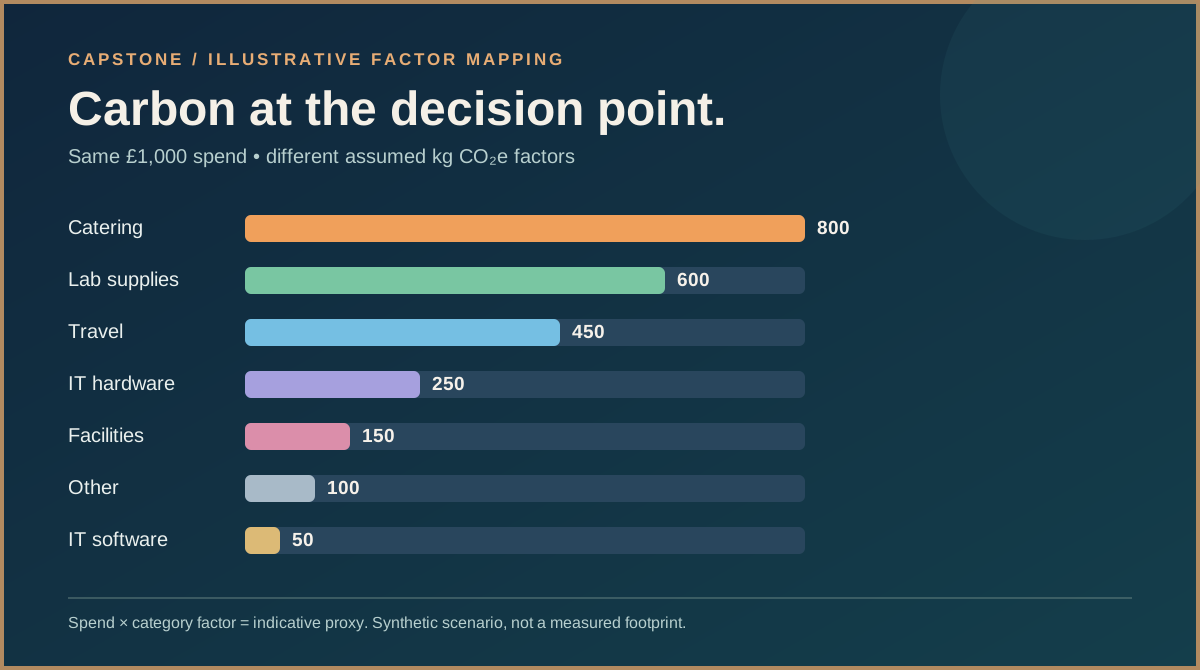
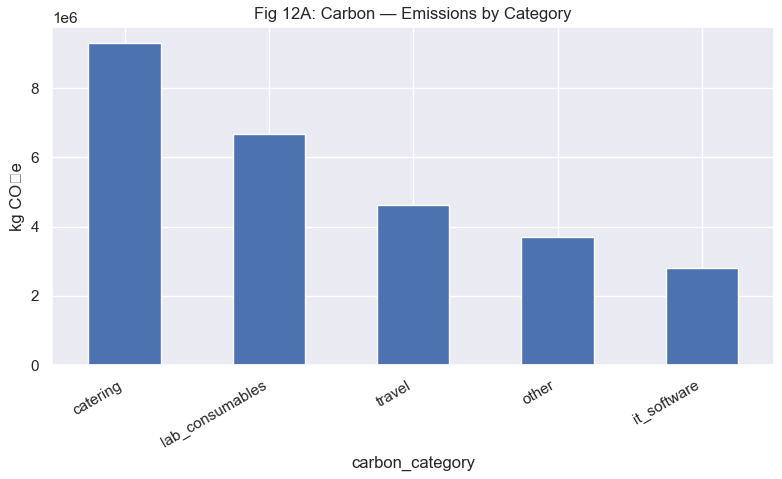
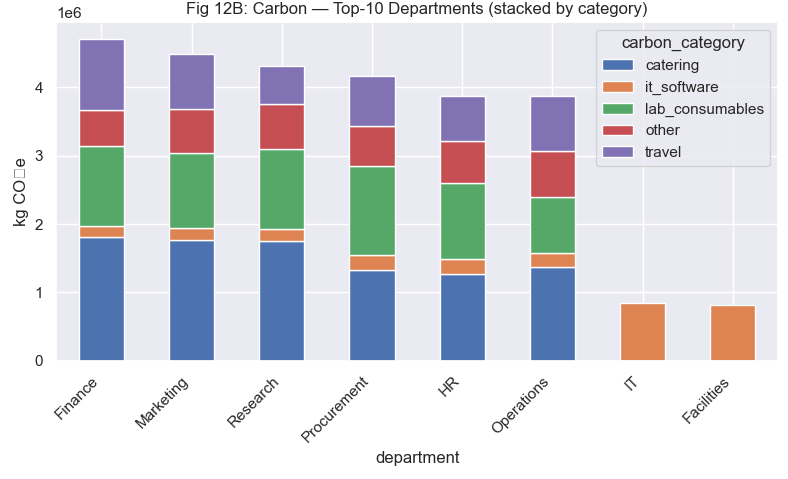
The implementation uses example factors for catering, lab consumables, travel, hardware, facilities, software and other purchases. No lifecycle boundary, supplier-specific factor or externally verified benchmark is established by these charts. The underlying Python is privately maintained and I’m happy to discuss the calculation and its limitations.
Explore the capstone ↗03C / STAFF SURVEY REHEARSAL
Plot the method; name the simulation.
The academic notebook prepared 2,000 synthetic staff records and built interactive views of survey themes, cohorts and risk. Its first static sentiment and topic charts are original outputs, but those particular labels were assigned randomly. They demonstrate rendering, not the state of any real workforce or a validated model.
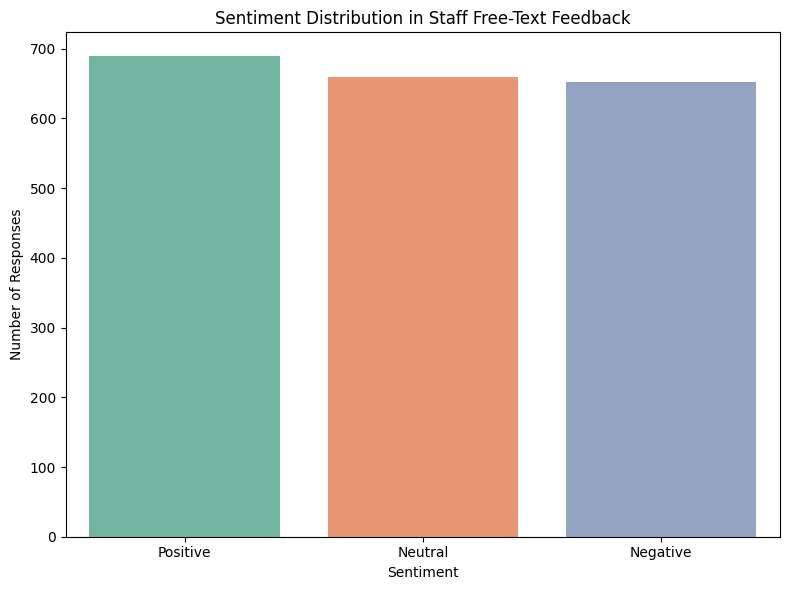
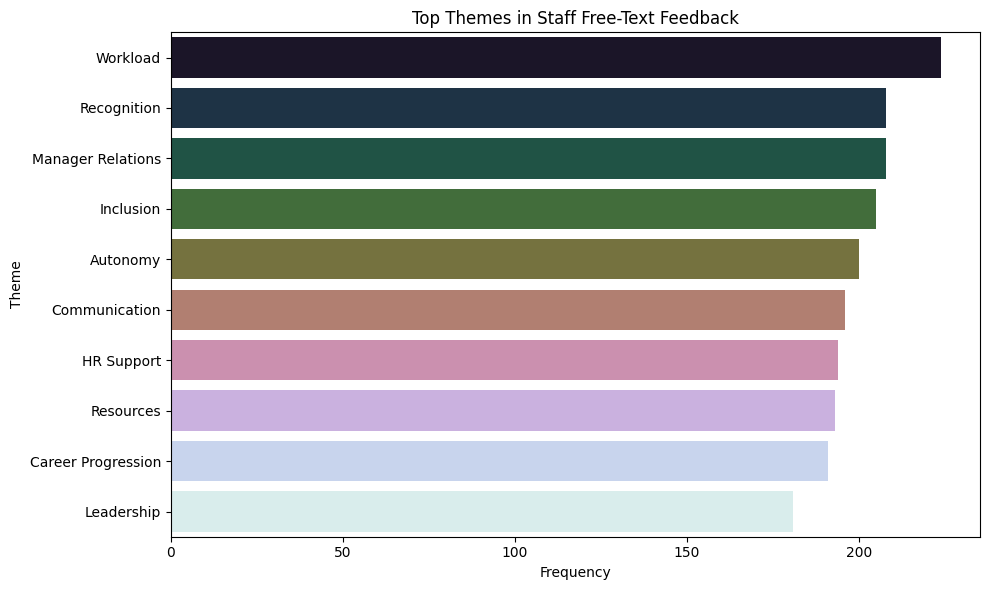
The notebooks and reports describe richer predictive and pipeline ambitions. The figures shown here do not substantiate operational deployment, model accuracy or real employee risk. Read the staff and student research boundary ↗
04 / FROM ANALYSIS TO DECISION
Make a funding question answerable.
In a requisition and purchase-order change case, analysis connected validated pain points to a mapped current process, requirements and a proposed future state. A February 2026 presentation recorded that funding had been confirmed on 30 January 2026. This is evidence of the case’s progression, not a claim that the predictive models generated a saving.
The evidence that moved the conversation
05 / MEETING AGENTS
A controlled test before a service.
The proof of concept connected meeting preparation, scheduling and follow-up with routing and integration roles. This public diagram replaces internal environment views and demo prompts, preserving the useful distinction between configured roles and tested behaviour.
Three task agents, two supporting roles
Briefing and links, with a fallback when sources are absent.
Candidate windows and conflict checks for human review.
Drafted summary and actions for the organiser to confirm.
Route the request to a suitable task agent.
Connect approved services within permission boundaries.
Reported on 27 October 2025. Further privacy and reliability gates remained.
06 / RESTRICTED REAL DATA
Show the method; protect the records.
Three investigations used real, restricted operational exports. The screen below is a public reconstruction of the kinds of views an analyst used. Its bars have no relationship to the source values and should not be read as actual results.
From an export to a decision
Choose a comparable measure, inspect coverage and missingness, then check the operational context before acting.
Example bars only · no workplace dataHarmonise questions and preserve missing answers.
Welcome Week ↗Review under-use without auto-reclaiming access.
Licence analysis ↗Surface patterns without ranking people.
Feedback study ↗Check source quality and consequences before a change.
My method ↗06B / LICENCE STEWARDSHIP
Use the visual to ask, then verify.
The December 2025 usage notebook explored licence categories, last activity, content creation and candidate review. Its original charts encode restricted counts and user-level patterns. This new matrix retains the analytical idea with invented positions and no real values.
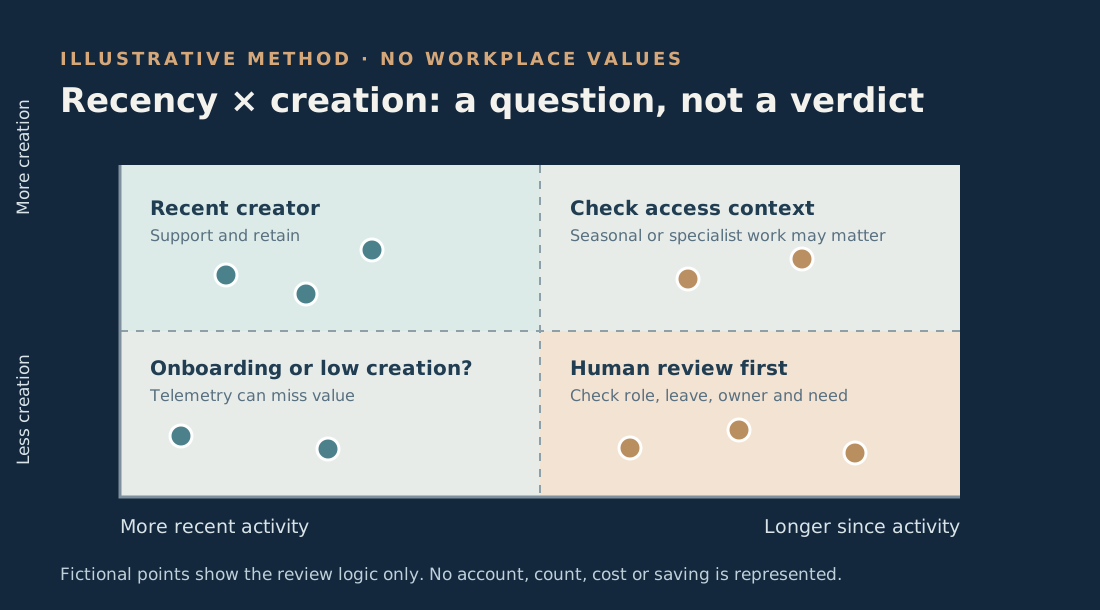
One source chart counted the month of each person’s last activity. That distribution is not a monthly active-user history, so its extrapolation is not a verified forecast. The real export, counts and Python code remain private. Explore the licence case ↗
07 / PROPOSED CAPABILITIES
Designs with a clear stage.
The campus wayfinding concept and Data Academy pathway were proposals. They show how I framed service design and capability uplift; the slides do not establish that a live campus platform or every planned class was delivered.
A wayfinding concept built in layers
A planned learning pathway for the team
Shared language and the questions to ask.
Understand the lifecycle and responsible use of generative AI.
Work through an end-to-end example and discuss limits.
Six courses, three steps toward confidence.
A proposed route for the change team. The source planned roughly 29 hours of course material and seven booked three-hour team sessions; the difference called for independent study. This is curriculum design, not a completion chart.
AI Fundamentals for Data Professionals
Generative AI for Data Analysis
Python for Data Science & ML
THE EVIDENCE BOUNDARY
Public charts and diagrams explain what was studied, built or proposed. Originals from the previous employer contain names, branding, internal data and working details, so they are not downloadable here. The original notebook charts above are real outputs from fictional records; the colourful factor illustration is a new public reconstruction of the calculation. I keep the Python code and source evidence privately and welcome questions about methodology, validation and what would be required for responsible use.
Return to the AI & Data portfolio ↗EXPLAINABLE AI & DATA / READ THE METHOD
Read the evidence, understand the method.
A guide to the charts and case evidence on this page. Exhibit captions remain the authority for data origin and the claims each visual supports.
Follow the reasoning.
- SourceRead the exhibit’s evidence label
- RepresentInspect units, categories and scales
- CompareDistinguish observed results from demonstrations
- ReviewCheck limitations before taking action
Explore the building blocks.
Number of concepts in this guide, not performance or usage measures.
Explore the explanation matrix · 14 concepts
14 concepts shown
On small screens, scroll the table sideways. “Learning context” explains a related idea; it does not mean that method runs on this page. Deep learning is the standard term for “deep ML”.
| Technical term | Technical description / definition | In plain English | How this page uses it |
|---|---|---|---|
| Visual encodingVisualisation | Mapping values or categories to marks, position, length, colour and labels.Primary reference ↗ | Make the comparison visible, with a scale and a clear label. | Published analysis Read axis labels, denominators and captions before comparing exhibits. |
| Synthetic dataAI/Data Concepts | Generated records used to represent scenarios rather than directly report observed individuals or events.Primary reference ↗ | A practice dataset. Useful for demonstration, not proof of workplace impact. | Demonstration Exhibits labelled synthetic or reconstructed illustrate methods; they are not disclosed workplace records. |
| Descriptive analyticsAI/Data Concepts | Summaries of observed data using counts, rates, distributions or comparisons.Primary reference ↗ | Tell us what the records show; this alone does not predict next week. | Published analysis Counts and trend summaries describe the stated records and period, not future performance. |
| Residuals and prediction errorEvaluation & XAI | A residual compares an observed value with its fitted or predicted value. Error metrics summarise those discrepancies.Primary reference ↗ | How far did the estimate miss, and where does it miss most? | Learning context Prediction exhibits can compare observed and estimated values; a smooth chart alone is not validation. |
| Confusion matrix, precision and recallEvaluation & XAI | A confusion matrix counts predicted versus actual classes. Precision measures positive-result reliability; recall measures positive-case coverage.Primary reference ↗ | Which alarms were right, which were false, and which cases were missed? | Learning context Where a confusion chart is shown, inspect false alarms and missed cases as well as correct predictions. |
| Data science pipelineData Science Pipeline | An ordered, reproducible sequence for acquiring, validating, preparing, analysing and evaluating data.Primary reference ↗ | A chain from a question and source to an answer someone can check. | Published analysis Case studies connect the problem, evidence, preparation, method, evaluation and decision. |
| Explanation versus causal proofEvaluation & XAI | A model explanation describes selected behaviour or contributions; it does not establish causal effects or full reliability.Primary reference ↗ | A reason for this output is useful, but it is not proof that the model is right. | Responsible use A persuasive visual does not prove causation or transferability. |
| Data minimisationResponsible AI | Limit collected, disclosed and retained information to what is needed for the stated purpose.Primary reference ↗ | Use the smallest appropriate amount of information. | Responsible use Restricted source records stay private; approved aggregates and labelled reconstructions support public learning. |
| pandasPython Package | A Python library for labelled tabular data manipulation and analysis.Primary reference ↗ | A programmable workbench for cleaning and comparing tables. | Learning context A common Python option for tabular preparation; its inclusion is not a claim that this browser runs pandas. |
| MatplotlibPython Package | A Python plotting library for static, animated and interactive visualisations.Primary reference ↗ | Turn numerical work into labelled figures that can be inspected and shared. | Learning context A common way to prepare Python figures. This page displays published assets rather than launching Python plotting sessions. |
| Machine learning (ML)AI Capability | Methods that estimate patterns or parameters from examples to support inference on other inputs.Primary reference ↗ | Learn a pattern from examples, then check whether it helps with new ones. | Learning context ML learns from examples. Read the page-specific methods below to see whether any model runs here. |
| Deep learningAI Capability | Machine learning using neural networks with multiple representation-learning layers.Primary reference ↗ | A layered model learns useful representations; more layers do not guarantee a better answer. | Learning context Deep learning is an AI capability, not a label for every chart. No deep model is implied by this explanation panel. |
| Natural language processing (NLP)AI Capability | Computational methods for representing, analysing or generating human language.Primary reference ↗ | Help a computer work with words, while remembering that context matters. | Learning context Text search, translation, thematic classification and generation are different language tasks; their implementation is identified separately. |
| Sentiment analysisAI Capability | A language-analysis task that estimates an expressed attitude, often as polarity or sentiment categories.Primary reference ↗ | Estimate the tone of words—not the private feelings or personality of their author. | Learning context Sentiment estimates expressed tone. It must not be confused with topic classification or a diagnosis of a person. |
No matching concepts. Choose another category or clear the search.