Who lives in a place?
All residents, whatever their ancestry. Useful for schools, infrastructure and services.
Context-aware translation drafts. Original English remains available.
Russian celebrates Daria and Adémidé’s family heritage; Igbo celebrates Lékan’s maternal roots.
Translation notes & sourcesSuggest a correction ↗TAPESTRIES / PEOPLE & POPULATION
Explore the states, countries and generations of the Yorùbá world. See what the numbers describe, where they stop, and how assumptions change the picture.
Evidence reviewed 6 October 2026 · mixed reference years · estimates remain revisable
Yorùbáland is a cultural geography; a state is an administrative unit. Its residents include people of many identities, while Yorùbá people also live far beyond it. State populations therefore provide context, not an ethnic headcount.
The ledger assembles an indicative 51.5 million across the numeric entries, including selected related Èdè communities. It is an incomplete, mixed-source working estimate—not a 2026 census, a statistical lower bound, or the total of everyone with Yorùbá ancestry. The older Atlantic diaspora and several modern destinations remain unquantified.
All residents, whatever their ancestry. Useful for schools, infrastructure and services.
Ethnic or cultural belonging; language counts are a different, overlapping measure.
May include mixed ancestry and people who do not speak Yorùbá or use the identity today.
PEOPLE / ECONOMIES / GOVERNANCE
Compare Lagos, Ogun, Oyo, Osun, Ondo, Ekiti, Kwara, Kogi and Edo, then look across the border to the Republics of Benin and Togo. Edo is a neighbouring comparison, not a claim that Edo/Bini people are Yorùbá.
Evidence reviewed 25 October 2026. Each measure retains its own reference year; these are not live 2026 counts.
State figures cover all residents.
IGR is government income; GDP measures production.
Modelled estimates are labelled separately.
Train the revenue model, inspect its backtests, and adjust population, youth, output and resource scenarios.
Open the Regional Forecast Lab →Two comparable state geographies, two different kinds of evidence: the 2006 census and the NPC 2023 projections published by NBS. Differences include assumed demographic change; they are not directly observed migration or a new census.
| State | 2006 census | 2023 projection | Difference (%) |
|---|---|---|---|
| Lagos | 9,113,605 | 13,710,862 | 50.4% |
| Ogun | 3,751,140 | 6,512,195 | 73.6% |
| Oyo | 5,580,894 | 8,127,483 | 45.6% |
| Osun | 3,416,959 | 4,494,970 | 31.5% |
| Ondo | 3,460,877 | 5,422,399 | 56.7% |
| Ekiti | 2,398,957 | 3,667,047 | 52.9% |
| Kwara | 2,365,353 | 3,626,882 | 53.3% |
| Kogi | 3,314,043 | 4,557,686 | 37.5% |
| Edo | 3,233,366 | 4,874,613 | 50.8% |
NBS / NPC · 2006 baseline ↗ · NBS · 2023 projections, Annex 3 ↗
Administrative boundaries changed. Ekiti was separated from Ondo in 1996; a 1991 Ondo total therefore includes what later became Ekiti. Different projection vintages also revise assumptions. Joining older and newer forecasts can create a false impression of population decline or growth.
Internally generated revenue (IGR) is government revenue, not GDP or household wealth. Charts use GBP billions; tables show GBP, USD and NGN in that order. Nominal increases may reflect inflation, collection changes and economic activity.
| State | 2022 | 2023 | 2024 | 2025 |
|---|---|---|---|---|
| Lagos | £0.326bn $0.429bn ₦651.146bn | £0.408bn $0.537bn ₦815.865bn | £0.631bn $0.831bn ₦1.262tn | £0.885bn $1.165bn ₦1.769tn |
| Ogun | £0.060bn $0.079bn ₦120.584bn | £0.073bn $0.097bn ₦146.875bn | £0.098bn $0.128bn ₦194.934bn | £0.126bn $0.166bn ₦252.356bn |
| Oyo | £0.031bn $0.041bn ₦62.246bn | £0.026bn $0.035bn ₦52.745bn | £0.033bn $0.043bn ₦65.287bn | £0.052bn $0.068bn ₦103.246bn |
| Osun | £0.012bn $0.016bn ₦24.605bn | £0.014bn $0.018bn ₦27.925bn | £0.027bn $0.036bn ₦54.768bn | £0.028bn $0.037bn ₦56.844bn |
| Ondo | £0.016bn $0.021bn ₦32.641bn | £0.021bn $0.027bn ₦41.502bn | £0.024bn $0.032bn ₦48.639bn | £0.030bn $0.040bn ₦60.321bn |
| Ekiti | £0.009bn $0.011bn ₦17.030bn | £0.016bn $0.021bn ₦32.096bn | £0.018bn $0.023bn ₦35.214bn | £0.029bn $0.038bn ₦57.091bn |
| Kwara | £0.018bn $0.024bn ₦35.757bn | £0.030bn $0.039bn ₦59.643bn | £0.036bn $0.047bn ₦71.197bn | £0.048bn $0.063bn ₦95.357bn |
| Kogi | £0.009bn $0.012bn ₦18.214bn | £0.013bn $0.018bn ₦26.780bn | £0.016bn $0.021bn ₦32.013bn | £0.022bn $0.029bn ₦43.941bn |
| Edo | £0.024bn $0.031bn ₦47.458bn | £0.032bn $0.043bn ₦64.671bn | £0.046bn $0.060bn ₦91.152bn | £0.066bn $0.087bn ₦132.209bn |
NBS · 2025 IGR release, published 24 September 2026 ↗
The denominator is only these nine states’ combined 2025 IGR. It is not Nigeria’s total revenue and not a share of Yorùbá wealth.
£1.286bn
$1.693bn
₦2.571tn
Combined 2025 IGR
Total fertility rate, measured in children per woman: NPC estimates for 2015 and 2022 published by NBS. Fertility is one demographic influence alongside mortality and migration. These are not 2026 rates or an ethnic comparison.
| State | 2015 | 2022 |
|---|---|---|
| Lagos | 3.82 | 3.28 |
| Ogun | 4.74 | 3.35 |
| Oyo | 4.53 | 4.27 |
| Osun | 3.98 | 3.75 |
| Ondo | 4.73 | 3.95 |
| Ekiti | 4.41 | 4.32 |
| Kwara | 5.12 | 5.55 |
| Kogi | 4.42 | 4.96 |
| Edo | 4.55 | 4.46 |
PRODUCTION / PLACE / REPRESENTATION
GDP below reproduces NGF’s 2023 state profiles. Their price basis and estimation method are not stated, so this is a source-specific snapshot, not a harmonised real-growth ranking. No GDP growth is calculated by joining it to a different series.
| State / capital | GDP 2023 · GBP / USD / NGN | House of Assembly seats | Present-state formation |
|---|---|---|---|
| Lagos / Ikeja | £16.532bn $21.768bn ₦33.052tn Source ↗ | 40 ↗ | 1967 |
| Ogun / Abeokuta | £6.128bn $8.069bn ₦12.252tn Source ↗ | 26 ↗ | 1976 |
| Oyo / Ibadan | £5.899bn $7.767bn ₦11.793tn Source ↗ | 32 ↗ | 1976; Osun separated in 1991 |
| Osun / Osogbo | £3.710bn $4.885bn ₦7.417tn Source ↗ | 26 ↗ | 1991 |
| Ondo / Akure | £4.387bn $5.777bn ₦8.771tn Source ↗ | 26 ↗ | 1976; Ekiti separated in 1996 |
| Ekiti / Ado-Ekiti | £2.309bn $3.041bn ₦4.617tn Source ↗ | 26 ↗ | 1996 |
| Kwara / Ilorin | £3.937bn $5.184bn ₦7.871tn Source ↗ | 24 ↗ | 1967; boundaries later changed |
| Kogi / Lokoja | £2.982bn $3.927bn ₦5.963tn Source ↗ | 25 ↗ | 1991 |
| Edo / Benin City | £3.773bn $4.968bn ₦7.544tn Source ↗ | 24 ↗ | 1991, from Bendel |
Each Nigerian state has a unicameral House of Assembly responsible for state legislation, appropriation and executive oversight. Federal lawmaking sits with the National Assembly: Senate and House of Representatives. Traditional institutions and cultural regions are not substitutes for these constitutional chambers.
Èkó and a cosmopolitan population. State, metropolis and historic city are different geographical units.
Finance, trade, ports and logistics, manufacturing, technology and entertainment.
Egba, Ìjẹ̀bú, Remo and Yewa communities; an industrial and agricultural corridor adjoining Lagos.
Industrial estates, cement and food manufacturing; cassava, rice and poultry.
Ìbàdàn, Ọ̀yọ́ and Òkè-Ògùn; a large inland network of cities, towns and farms.
Education, health and services in Ibadan; cassava, cocoa, poultry and agro-processing.
Ilé-Ifẹ̀, Òṣogbo, Ìjẹ̀ṣà and Ìgbómìnà communities; historic urban centres and rural hinterlands.
Cocoa, oil palm, cassava, gold, trade and cultural tourism.
Oǹdó, Akure, Owo, Akoko and coastal communities; substantial internal diversity.
Cocoa, oil and gas, fisheries and Idanre tourism; bitumen is a resource opportunity, not a claim of full commercial production.
Èkìtì towns and kingdoms; a separate state since 1996, previously part of Ondo.
Agriculture, education and public service; cocoa, rice, cassava, oil palm and tourism.
Offa, Oró, Edidi and other Yorùbá communities share a multiethnic state with other peoples.
Agriculture, commerce, services, agro-processing and aviation-related facilities.
Okun and other Yorùbá communities form part of a multiethnic state; the whole state is not Yorùbáland.
Cashew and other agriculture; iron ore, limestone and cement, including the Itakpe and Obajana industrial connections.
Edo is included as a neighbouring comparison requested by Lekan. Benin City and Edo/Bini heritage are not relabelled as Yorùbá; historical connections do not erase distinct identities.
Rubber, oil palm, cocoa, timber, agro-processing, oil and gas; Benin art and cultural heritage.
MOVEMENT / OPPORTUNITY / CONNECTION
Over 80% of migrants in the analysed national sample moved from somewhere within their current state.
Lagos and the FCT were major destinations. Neighbouring states also showed strong migration links.
Trade journeys, permanent relocation and diaspora ancestry measure different things. Cross-border trading communities cannot be counted as recent Nigerian emigrants by default.
The UN/IOM/UNICEF analysis uses Nigeria’s 2021 MICS sample aged 15–49. Nearly 60% of women and almost 50% of men sampled had moved at some point. These are national survey findings, not Yorùbá-specific rates or annual state migration totals. Economic opportunity, marriage and conflict are suggested explanations; the survey did not directly ask why people moved.
BENIN REPUBLIC / TOGO REPUBLIC
Benin City is in Edo State, Nigeria. The Republic of Benin is a separate country. Yorùbá, Nago and related communities in Benin, and Ifè communities in Togo, have long local histories. National statistics below describe their wider setting, not their own population or production.
| Measure | Benin Republic | Togo Republic |
|---|---|---|
| Earlier national census | 6,769,914 (2002); 10,008,749 (2013) | 8,095,498 (2022) |
| National population estimate · 2025 | 14,814,460 | 8,591,626 |
| National GDP · 2025, GBP / USD / NGN | £18.658bn $24.566bn ₦37.301tn | £9.030bn $11.890bn ₦18.054tn |
| National real GDP growth · 2025 | 8.1% | 6.3% |
| National net migration estimate · 2025 | −7,847 | −15,010 |
| National legislature | National Assembly (109 seats) and Senate | National Assembly (113 seats); Senate (61 statutory seats) |
World Bank · Benin ↗ · World Bank · Togo ↗
Net migration is arrivals minus departures, not the number of people who left. National GDP equivalents are shown in GBP, USD and NGN and are not added to the Nigerian state figures. Benin’s Senate follows the 2025 constitutional revision; Togo’s parliamentary system also has two chambers. Statutory seats do not imply every seat is currently occupied.
The 2013 census category “Yoruba et apparentés” represented 12.0% nationally. Within departments, the share was 68.7% in Plateau, 46.2% in Collines, 10.9% in Littoral and 10.1% in Ouémé. These percentages describe each department’s population, not the distribution of all Yorùbá people.
The older ledger below uses a constant-share scenario for 2025; it is an explicit assumption, not an updated ethnic census. This dashboard keeps the observed 2013 category separate.
Ifè communities around Atakpamé and Ogou are documented in Togolese cultural reporting. No comparable official Yorùbá-specific population or output total was verified for this edition. The 2022 census reports a national urban share of 42.9% and female share of 51.3%; neither is an ethnic profile.
Benin’s economy is shaped by agriculture, Cotonou’s port, trade and transport. Togo combines Lomé’s logistics role with agriculture, phosphates and industrial development. Benin–Nigeria trade was disrupted by Nigeria’s 2019–2020 border closure; commercial mobility should not be confused with permanent migration.
Population: NBS/NPC, 2006 census and 2023 projection. Fertility: NBS 2022 bulletin. Revenue: NBS 2025 IGR release. GDP and economic specialisms: individual NGF profiles. Legislative seats: linked official sources in the matrix.
Download the state comparison (CSV) · Download data and source ledger (JSON)
These eight states contain major Yorùbá communities. The table gives all-state residents in the official 2019 projection series. Kwara and Kogi include substantial non-Yorùbá populations; the other states are not ethnically uniform either. No verified state-by-state ethnic percentages are imposed.
NBS · Demographic Statistics Bulletin 2020, Annex 1. This older, directly inspectable common series is retained as a baseline rather than presented as the latest count. The optional 2026 column is our calculation, not an official update.
2026 scenario = 2019 residents × (1 + rate ÷ 100)7. The starting 2.5% is an assumption; one rate does not model each state’s migration or fertility.
| State | 2019 projection | 2026 scenario | Geographical context |
|---|---|---|---|
| Èkó (Lagos) | 12,772,884 | — | Èkó and a cosmopolitan population |
| Oyo | 7,512,855 | — | Ìbàdàn, Ọ̀yọ́ and Òkè-Ògùn |
| Ogun | 5,945,275 | — | Egba, Ìjẹ̀bú, Remo and Yewa communities |
| Ondo | 4,969,707 | — | Oǹdó, Akure, Owo, Akoko and coastal communities |
| Osun | 4,237,396 | — | Ilé-Ifẹ̀, Òṣogbo, Ìjẹ̀ṣà and Ìgbómìnà communities |
| Ekiti | 3,350,401 | — | Èkìtì towns and kingdoms |
| Kwara | 3,259,613 | — | Oró, Edidi, Offa and other communities; multiethnic state |
| Kogi | 4,153,734 | — | Okun and other Yorùbá communities; multiethnic state |
The state rows are not added to the worldwide ledger.
Yorùbá people in Abuja, northern Nigeria, Edo and other states also belong in a Nigeria-wide estimate. Equally, adding all of Kwara and Kogi to the six southwestern states would count neighbouring peoples as Yorùbá. Estimating the population within a cultural outline would require a defined boundary, spatial population data and a separate question about identity. This table does not claim to have done that.
Administrative totals also differ from cities: Èkó (Lagos) State, metropolitan Èkó (Lagos) and Èkó as a historical place are not interchangeable. Return to the atlas to explore the geography behind the names.
Benin and Togo contain longstanding homeland communities, not simply Nigerian emigrants. Elsewhere in West Africa, trading, settlement, displacement and return migration have produced histories that do not fit neatly into “old” and “new.”
Source caution: most country entries below come from Joshua Project, an evangelical mission research database. Its estimates are useful leads, with uneven coverage and no common census year in the country table. They are not official statistics. The Benin calculation and Canadian census subgroup are explicitly different measures.
All country entries
| Country / coverage | People | Measure & assumption | Source |
|---|---|---|---|
| Nigeria | 47,784,000 | Compiled estimate Entire country; includes Yorùbá outside the southwestern states. Not a territorial Yorùbáland count. | Joshua Project |
| Benin | 1,776,000 | Derived scenario · 2025 14,800,000 × 12% = 1,776,000. Assumes the 2013 “Yoruba and related” share persists. Replaces, rather than adds to, the narrower Joshua Project Benin entry. | Benin state report to the UN · UNFPA |
| Togo | 410,000 | Combined related categories 151,000 Yoruba + 186,000 Ife + 73,000 Kambole. Treats the source’s separately listed categories as non-overlapping; local identities remain distinct. | Joshua Project · Joshua Project · Joshua Project |
| Ghana | 568,000 | Compiled estimate Yorùbá country entry; includes communities with differing migration histories. | Joshua Project |
| Côte d’Ivoire | 154,000 | Compiled estimate Yorùbá country entry; includes communities with differing migration histories. | Joshua Project |
| Niger | 89,000 | Compiled estimate Yorùbá country entry; includes communities with differing migration histories. | Joshua Project |
| Burkina Faso | 85,000 | Compiled estimate Yorùbá country entry; includes communities with differing migration histories. | Joshua Project |
| Liberia | 28,000 | Compiled estimate Yorùbá country entry; includes communities with differing migration histories. | Joshua Project |
| The Gambia | 13,000 | Compiled estimate Yorùbá country entry; includes communities with differing migration histories. | Joshua Project |
| Sierra Leone | 7,100 | Compiled estimate Yorùbá country entry; includes communities with differing migration histories. | Joshua Project |
| Ghana · related Ife category | 46,000 | Related category Separate source category added once; not part of the 568,000 Yoruba entry in this database. | Joshua Project |
| Mali and other West African countries | Not quantified | No comparable count verified for this edition. Mali appears in the community network; absence of a number does not mean absence of people. | Yoruba Indigenes’ Foundation |
| Equatorial Guinea | 88,000 | Compiled estimate Selected country entry, not a total for Central Africa. | Joshua Project |
| South Africa, Uganda and the rest of Africa | Not quantified | Community network evidence; no comparable continent-wide remainder verified. | Yoruba Indigenes’ Foundation |
| United Kingdom | 105,000 | Compiled estimate Selective country coverage; not an official ethnic census or a count of migration generations. | Joshua Project |
| Italy | 56,000 | Compiled estimate Selective country coverage; not an official ethnic census or a count of migration generations. | Joshua Project |
| Ireland | 10,000 | Compiled estimate Selective country coverage; not an official ethnic census or a count of migration generations. | Joshua Project |
| Greece | 5,000 | Compiled estimate Selective country coverage; not an official ethnic census or a count of migration generations. | Joshua Project |
| Finland | 1,200 | Compiled estimate Selective country coverage; not an official ethnic census or a count of migration generations. Source lists this outside its main total. | Joshua Project |
| Czechia | 400 | Compiled estimate Selective country coverage; not an official ethnic census or a count of migration generations. Source lists this outside its main total. | Joshua Project |
| France and the rest of Europe | Not quantified | France is represented in the community network. The subtotal below leaves unmeasured countries unfilled. | Yoruba Indigenes’ Foundation |
| United States | 205,000 | Compiled estimate Migration-era ancestry is not separated. Not a count of all African Americans with possible Yorùbá ancestry. | Joshua Project |
| Canada | 41,740 | Census subgroup · 2021 Yorùbá ethnic/cultural origin among Black populations: 30,920 single + 10,820 multiple responses. Replaces the much smaller mission-database entry. | Statistics Canada |
| Other recent-migration communities in the Americas | Not quantified | No comparable country-by-country remainder verified; separate from the Atlantic ancestry question. | Toyin Falola |
| China and the rest of Asia | Not quantified | The network identifies a China representative. This is not enough to estimate China, the Gulf, India or other Asian destinations. | Yoruba Indigenes’ Foundation |
| Australia | 2,100 | Compiled estimate Small-group entry outside the source’s main total. Language and ancestry counts can differ. | Joshua Project |
| New Zealand and the rest of Oceania | Not quantified | No comparable count verified for this edition. | Joshua Project |
Benin: the 2013 national category “Yoruba et apparentés” was 12%. Holding that share constant against UNFPA’s rounded 2025 total of 14.8 million produces about 1.78 million. This assumes no change in relative growth, migration or classification. It replaces the narrower 261,000 “Yoruba” entry in Joshua Project; adding both would overlap categories.
Togo: the working 410,000 adds three separately listed database entries: Yoruba, Ife and Kambole. That is a broader cultural-family convention, not an instruction about how any individual should identify, and not a census total. The Ghana Ife entry is likewise separate and explicitly labelled.
Do not absorb neighbouring peoples: the database’s broader “Yoruba cluster” also includes Igala and Itsekiri. Its total is excluded. Linguistic relationship is not permission to overwrite a people’s identity. Joshua Project · broader “Yoruba cluster”.
Here “newer diaspora” means modern migration and subsequent generations. Available figures often identify language or ethnic origin rather than migration era. The entries below are proxies for contemporary communities; they cannot cleanly separate every recent-migrant descendant from older Atlantic ancestry.
| Region | Covered entries | Meaning |
|---|---|---|
| Homeland countries | 49,970,000 | Sum of listed entries only; definitions and dates differ. |
| Other West Africa | 990,100 | Sum of listed entries only; definitions and dates differ. |
| Other Africa | 88,000 | Sum of listed entries only; definitions and dates differ. |
| Europe | 177,600 | Sum of listed entries only; definitions and dates differ. |
| Americas · modern entries | 246,740 | Sum of listed entries only; definitions and dates differ. |
| Asia | Unquantified | No numeric entry; not zero people. |
| Oceania | 2,100 | Sum of listed entries only; definitions and dates differ. |
Europe’s numeric entries sum to 177,600; the United States and Canadian subgroup together contribute 246,740; Australia contributes 2,100. Together that is about 426,000 in the listed non-African entries, not the full newer diaspora. Asia is unquantified, and many destinations and descendants are missing.
The ONS · Census 2021 main language (TS024) measures main language in England and Wales among people aged three and over. It is not a count of all Yorùbá people in the United Kingdom. A person with Yorùbá ancestry may report English as their main language. The US Census Bureau · Language use definitions also warns us through its categories: some tables group several West African languages together.
Canada’s official analysis reports 41,740 Yorùbá ethnic/cultural-origin responses within its Black populations, compared with a much smaller 3,700 entry in the mission database. We use the census subgroup once, and do not add its language count. This discrepancy is one reason the assembled total should not be sold as precise. Statistics Canada · Black populations, 2021, Chart 20.
Birthplace and nationality also miss local-born children and can include non-Yorùbá Nigerians. Community organizations establish a presence, not a headcount. Their work in China, France, Mali, South Africa and Uganda helps show where research should continue. Yoruba Indigenes’ Foundation · community network.
The Atlantic slave trade carried people from Yorùbá societies into the Americas. Their descendants preserved, reworked and shared names, music, language and knowledge under profoundly different conditions. A person can have Yorùbá ancestry alongside several other ancestries; cultural participation and descent need not coincide. Toyin Falola · Yorùbá Diaspora (Oxford, 2022).
Nagô / Kétu heritage, especially associated with Bahia; language, music and Candomblé carry lasting connections.
Descendant population: not reliably quantified here.
Historical sourceLucumí traditions preserve and transform Yorùbá inheritances. Religious participation is not a genealogical register.
Descendant population: not reliably quantified here.
Historical sourceNagô and other Yorùbá-linked inheritances form part of a wider, diverse Haitian cultural history. Vodou affiliation is not a Yorùbá ancestry count.
Descendant population: not reliably quantified here.
Historical sourceOrisha / Shango traditions and archival songs connect the islands with the Atlantic Yorùbá story.
Descendant population: not reliably quantified here.
Historical sourcePart of the Atlantic diaspora described in historical scholarship; a current Yorùbá-descendant total was not verified.
Descendant population: not reliably quantified here.
Historical sourceOlder ancestry, newer African migration and onward Caribbean or Brazilian migration can overlap within one family.
Descendant population: not reliably quantified here.
Historical sourceBrazil’s census racial categories do not isolate Yorùbá ancestry. Neither a Black/brown population total nor a count of Candomblé participants answers “how many people have at least one Yorùbá ancestor?” The same mismatch applies when people substitute Santería or Vodou participation for descent. IBGE · Brazil Census 2022, color or race.
Historical embarkation records and cultural archives can illuminate connections. They cannot simply be multiplied by present national populations: family lines intersect, migration continues, and ancestors are shared. A genetic reference population called “Yoruba” is not a census of all living descendants either. This edition therefore leaves descendant totals unquantified, rather than printing unsupported millions.
“Old” and “new” are historical lenses, not separate kinds of people. A Brazilian, Cuban or Haitian family may now live in Europe or North America, and one person may belong to both migration histories. Any future total must count each person once by present residence.
About 51.0 million in the listed African entries + 0.43 million in the listed non-African entries.
Plus unquantified populations, with overlap still to resolve. Older diaspora descendants and missing modern communities cannot yet be assigned a defensible combined number.
| Category | Included subtotal | Treatment |
|---|---|---|
| Nigeria, Benin and Togo | 49,970,000 | Country-wide entries; selected related communities included. |
| Other West Africa | 990,100 | Listed countries and Ghana’s separate Ife entry only. |
| Other Africa | 88,000 | Equatorial Guinea only; remainder unquantified. |
| Europe, Americas and Oceania | 426,440 | Selected modern entries; no clean migration-era split. |
| Asia and other missing modern communities | Unquantified | Not treated as zero population. |
| Older diaspora / wider descent | Unquantified | No separate numeric addition; overlap unresolved. |
| Arithmetic subtotal | 51,474,540 | Rounded to 51.5 million to avoid implying false precision. |
This is a transparent working estimate, not a consensus demographic finding. It combines a mission-database snapshot, an assumed Benin share and a Canadian census subgroup from different dates. Missing entries could increase coverage, while errors or overlapping definitions could change it in either direction. It is not a confidence interval or a proven minimum.
Adjust the Nigeria entry or supply net additional people not already covered. Blank means unknown. Inputs are your hypotheses, not sourced estimates. In particular, no default number is invented for the older diaspora. Values are in millions.
Formula: partial ledger − 47.784 million + your Nigeria assumption + any net additions supplied. Even if every field is completed, the result is a conditional scenario, not a verified global estimate. The state projection controls do not change this ledger.
A total near 70 million may be proposed as a hypothesis, but the reviewed evidence does not establish it as a current ethnic count or prove that every diaspora group sits outside it. Moving from this partial ledger to 70 million would require about 18.5 million in net additions or revisions, with their definitions and evidence made explicit.
Historical census disputes warrant serious scrutiny; they do not tell us an exact correction to apply. The purpose of this page is to make our people more visible while keeping the arithmetic open to challenge. Identity does not need an inflated number to matter.
Download the population ledger (CSV) · Download the figures and source notes (JSON). A blank population field means unquantified, never zero.
NPC state projections for 2019; PDF pages 13–14, printed pages 9–10. All residents, not ethnicity.
Snapshot reviewed 6 October 2026. Mission research database, not a census; individual estimate years are not stated in the country table. Selective coverage and uncertain comparability.
Separate related Èdè category. Togo 186,000; Ghana 46,000. Snapshot reviewed 6 October 2026.
Togo entry 73,000; Northern Nago. Snapshot reviewed 6 October 2026.
Ethnicity table: Yoruba et apparentés 12.0% nationally; 46.2% in Collines and 68.7% in Plateau. These are 2013 shares.
National population 14.8 million, rounded. Multiplying this by the older 12% share is our scenario, not a UN ethnic estimate.
30,920 single + 10,820 multiple Yorùbá ethnic/cultural-origin responses = 41,740 within the Black populations studied. A census-based subgroup count, not all Canadian ancestry or a 2026 estimate.
England and Wales, usual residents aged 3+. A language measure, not a UK-wide ancestry count; not added to the country estimate.
Some published tables group Yoruba, Twi, Igbo and other West African languages. A grouped total cannot be presented as Yorùbá alone.
Historical orientation to the West African and Atlantic diasporas. Does not establish present-day descendant totals.
Historical recordings and interpretation of Brazilian, Cuban, Haitian and Trinidadian cultural continuities; not demographic enumeration.
Documents cultural and linguistic heritage, including Candomblé da Nação Kétu. Its historical African speaker figure is not used as a current count.
Broad racial categories do not isolate Yorùbá ancestry. No fraction of Brazil’s Black or brown population is automatically assigned here.
Lists representatives in China, France, Mali, South Africa and Uganda, among other locations. Evidence of organizational reach, not a population survey.
Includes distinct peoples such as Igala and Itsekiri. Its 54.214 million snapshot total is not used as an ethnic Yorùbá total.
S. Adebanji Akintoye, A History of the Yoruba People (Amalion, 2010) and Akinwumi Ogundiran, The Yorùbá: A New History (Indiana University Press, 2020) provide wider historical reading. They are not cited as verification of this contemporary population ledger.
The next research step is better community enumeration: comparable questions, clear geography, self-described identity and transparent dates. That can help connect cultural education, language provision, enterprise and shared development possibilities to evidence.
YORÙBÁLAND / DEVELOPMENT
Connect the population discussion with education, public services, skills and productive work. The development hub avoids inventing a single regional economy or workforce total.
Explore the development hub → · Open both interactive maps → · Sources and review
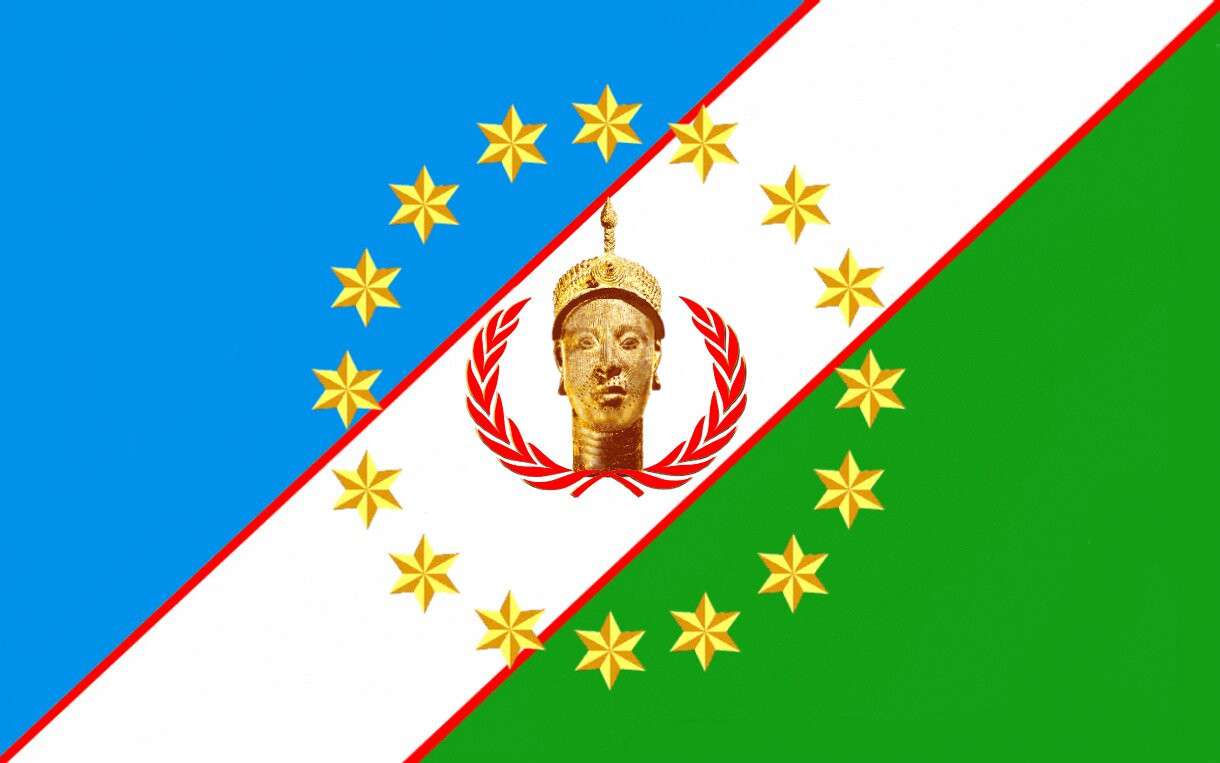
SHARED SYMBOLS
The Odùduwà flag carries a contemporary expression of Yorùbá identity across borders. Explore its colours, sixteen stars and central head, then listen to the Yorùbá nation anthem and the Ilé-Ifẹ̀ anthem.
Flag symbolism and Yorùbá nation anthem → · Ilé-Ifẹ̀ anthem and published lyrics →
Read the mapped layer, source date and geographic definition together. These visualisations are geographic explanations, not AI predictions or legal boundaries.
Number of concepts in this guide, not performance or usage measures.
7 concepts shown
On small screens, scroll the table sideways. “Learning context” explains a related idea; it does not mean that method runs on this page. Deep learning is the standard term for “deep ML”.
| Technical term | Technical description / definition | In plain English | How this page uses it |
|---|---|---|---|
| Geospatial layers and projectionVisualisation | Coordinates are transformed to a map surface; separate layers encode geographic features or interpretations.Primary reference ↗ | A map combines evidence layers. Its boundary lines need a date and a meaning. | Running here Separate layers show geographic features and interpreted historical or cultural regions. The source and definition control their meaning. |
| Visual encodingVisualisation | Mapping values or categories to marks, position, length, colour and labels.Primary reference ↗ | Make the comparison visible, with a scale and a clear label. | Running here Position, colour, area and labels make comparisons visible; changing the map view does not improve source certainty. |
| Rates and denominatorsAI/Data Concepts | A rate or share relates a count to a defined exposure or eligible population.Primary reference ↗ | Keep the number underneath the fraction visible when comparing people or periods. | Published analysis Area or population comparisons require compatible definitions and reference dates. |
| Extraction, transformation and provenanceData Science Pipeline | ETL moves data from sources through defined transformations; provenance records its origin and changes.Primary reference ↗ | Read it, tidy it, and keep the receipt. | Method guide Prepared geographic assets retain citations and boundaries of interpretation. |
| Probability and uncertaintyAI/Data Concepts | A probability quantifies an event under a model and assumptions; it is not a guarantee.Primary reference ↗ | A chance, not a promise. Ask what evidence and assumptions produced it. | Responsible use Approximate cultural extents and estimates should not be read as precise surveyed borders. |
| Human oversight and consentResponsible AI | People retain appropriate review authority, permission controls and correction routes for data use and outputs.Primary reference ↗ | Keep someone able to question, correct or stop the result. | Responsible use The map supports learning and inquiry, with source notes and correction routes. |
| Machine learning (ML)AI Capability | Methods that estimate patterns or parameters from examples to support inference on other inputs.Primary reference ↗ | Learn a pattern from examples, then check whether it helps with new ones. | Learning context These geographic views do not infer ethnicity, ancestry or future population from a trained ML model. |
No matching concepts. Choose another category or clear the search.

Olukotun Studios Ltd · Registered in England and Wales · No. 17537910
Registered office: 5 Brayford Square, London, E1 0SG, England.
